

Summary: The Hydrogen Council’s Global Hydrogen Compass 2026 reports approximately US$130 billion in committed clean hydrogen investment and a 70% increase in operational capacity over the preceding year. Yet demand certainty, infrastructure and policy implementation continue to shape project execution. For technology developers and equipment suppliers, the industry’s progress places increasing emphasis on system integration, reliable delivery and long-term operating performance.
From Project Announcements to Operating Assets
The global hydrogen industry is experiencing growth and restructuring at the same time. While some projects have been delayed or canceled, others are reaching final investment decisions, entering operation and securing long-term offtake.
Understanding this progress requires a clear distinction between announced projects, committed investment, construction and operational capacity.
Published in September 2026, the Hydrogen Council’s Global Hydrogen Compass 2026 draws on project tracking and market analysis conducted in collaboration with McKinsey & Company.
The report defines clean hydrogen as renewable and low-carbon hydrogen combined. It therefore covers more than renewable-powered water electrolysis. “Committed investment” refers to projects that have reached final investment decision or a later stage, collectively described as FID+. It does not mean that all associated capital has already been spent.
Within the report’s principal project pipeline targeting operation by 2030, committed investment has reached approximately US$130 billion across 579 projects. This investment spans production, distribution and end use. Committed clean hydrogen production capacity stands at approximately 6.9 million tonnes per year, of which around 1.7 million tonnes per year is operational.
These figures demonstrate an expanding industrial base. They should not, however, be interpreted as electrolyzer equipment market value or actual annual hydrogen output.
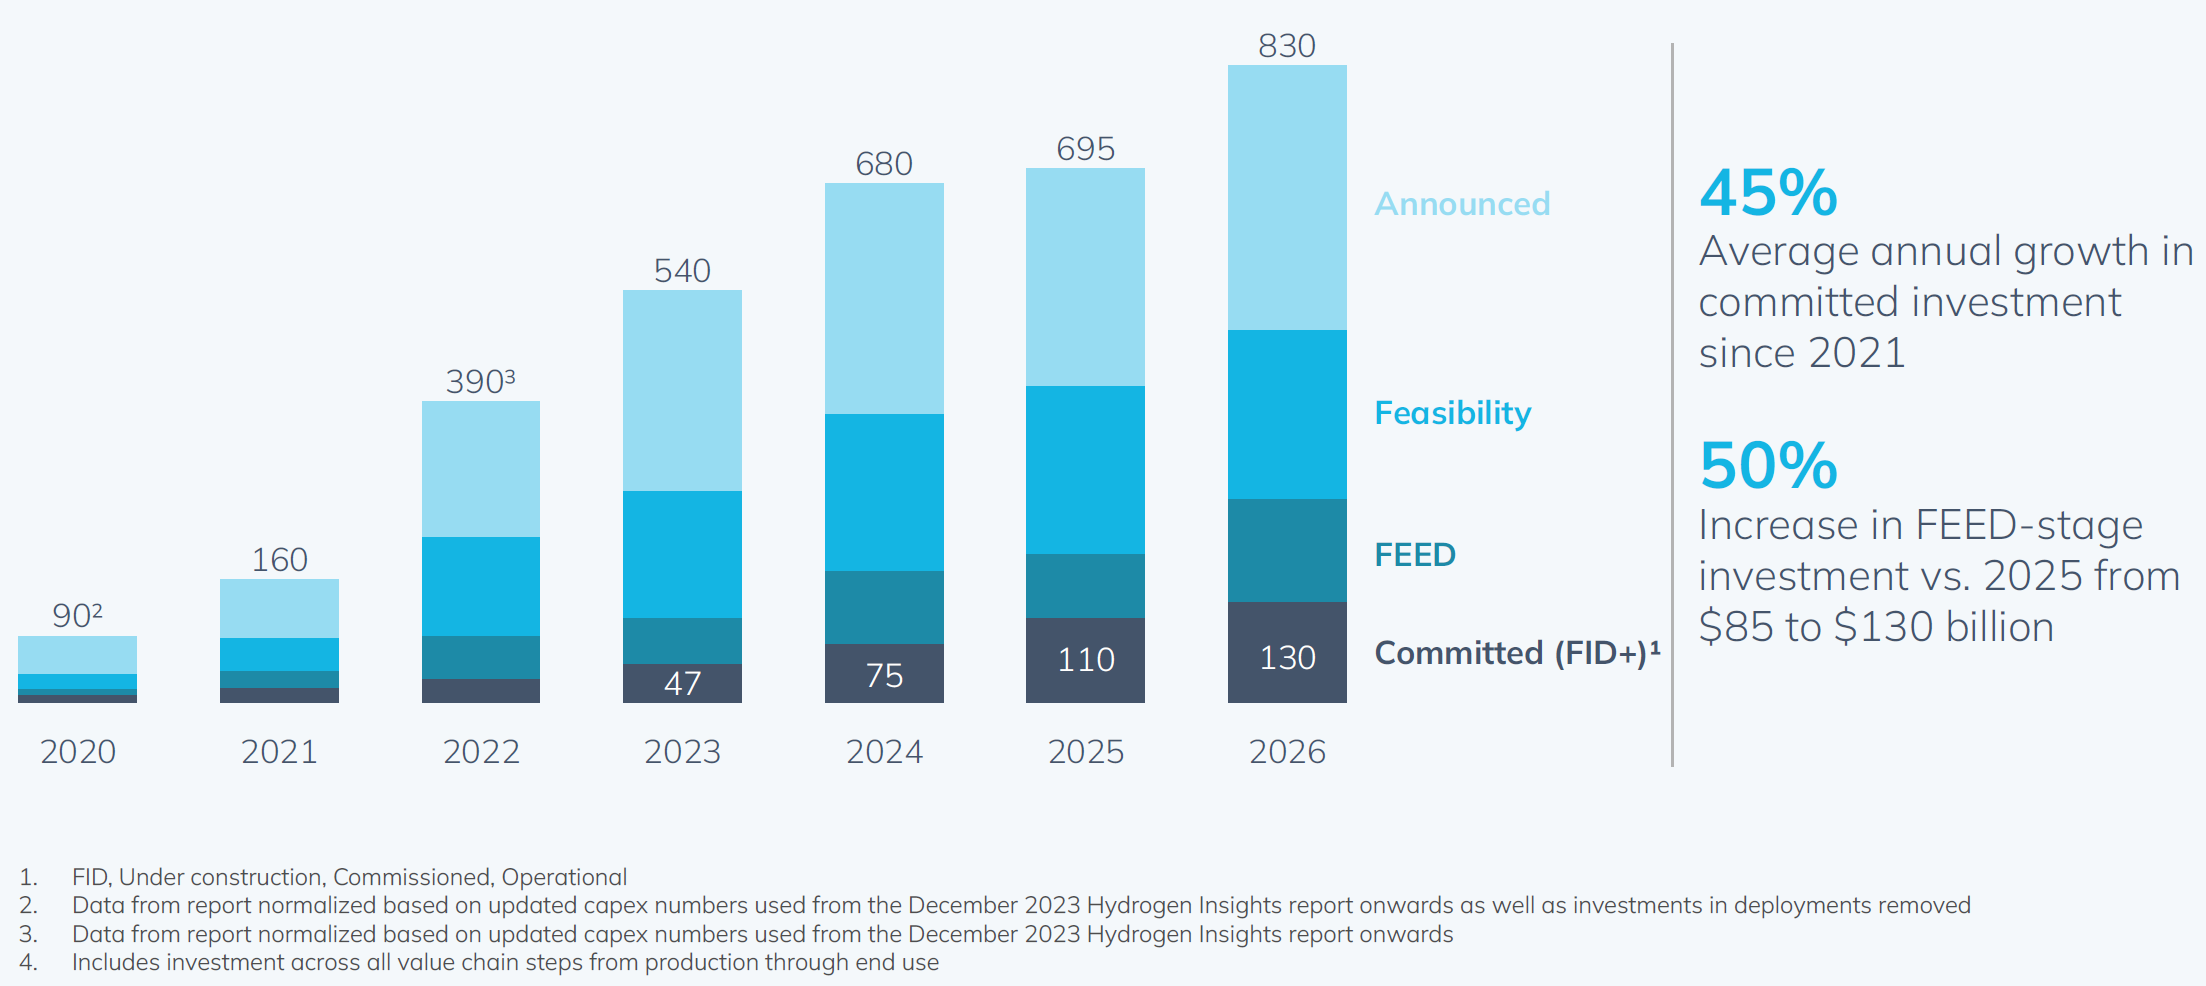
Figure 1. Investment in the global clean hydrogen project pipeline targeting operation by 2030, by project maturity. Values are in US$ billion. Committed investment includes projects at final investment decision and later stages. Source: Hydrogen Council, Global Hydrogen Compass 2026, Exhibit 6.
Growing Capacity Raises the Importance of Project Execution
Operational clean hydrogen capacity increased from approximately 1.0 to 1.7 million tonnes per year, representing growth of around 70%. Operational renewable hydrogen capacity grew by more than 85%, although low-carbon hydrogen still accounts for most capacity currently online.
Based on announced commissioning dates, the report indicates that operational clean hydrogen capacity could reach approximately 3.8 million tonnes per year in 2027. This remains a conditional outlook, subject to construction, commissioning and schedule risks.
Projects at FID or under construction are, on average, approximately ten times larger than projects already operating. This step change in scale brings technology into more demanding industrial environments.
For equipment suppliers, meeting a rated performance specification is only the beginning. Installation, commissioning, operational stability, maintenance planning and service capability all influence whether a project delivers usable supply on schedule.
Scaling hydrogen therefore requires more than manufacturing capacity. It requires the ability to deliver and sustain complete operating systems.\
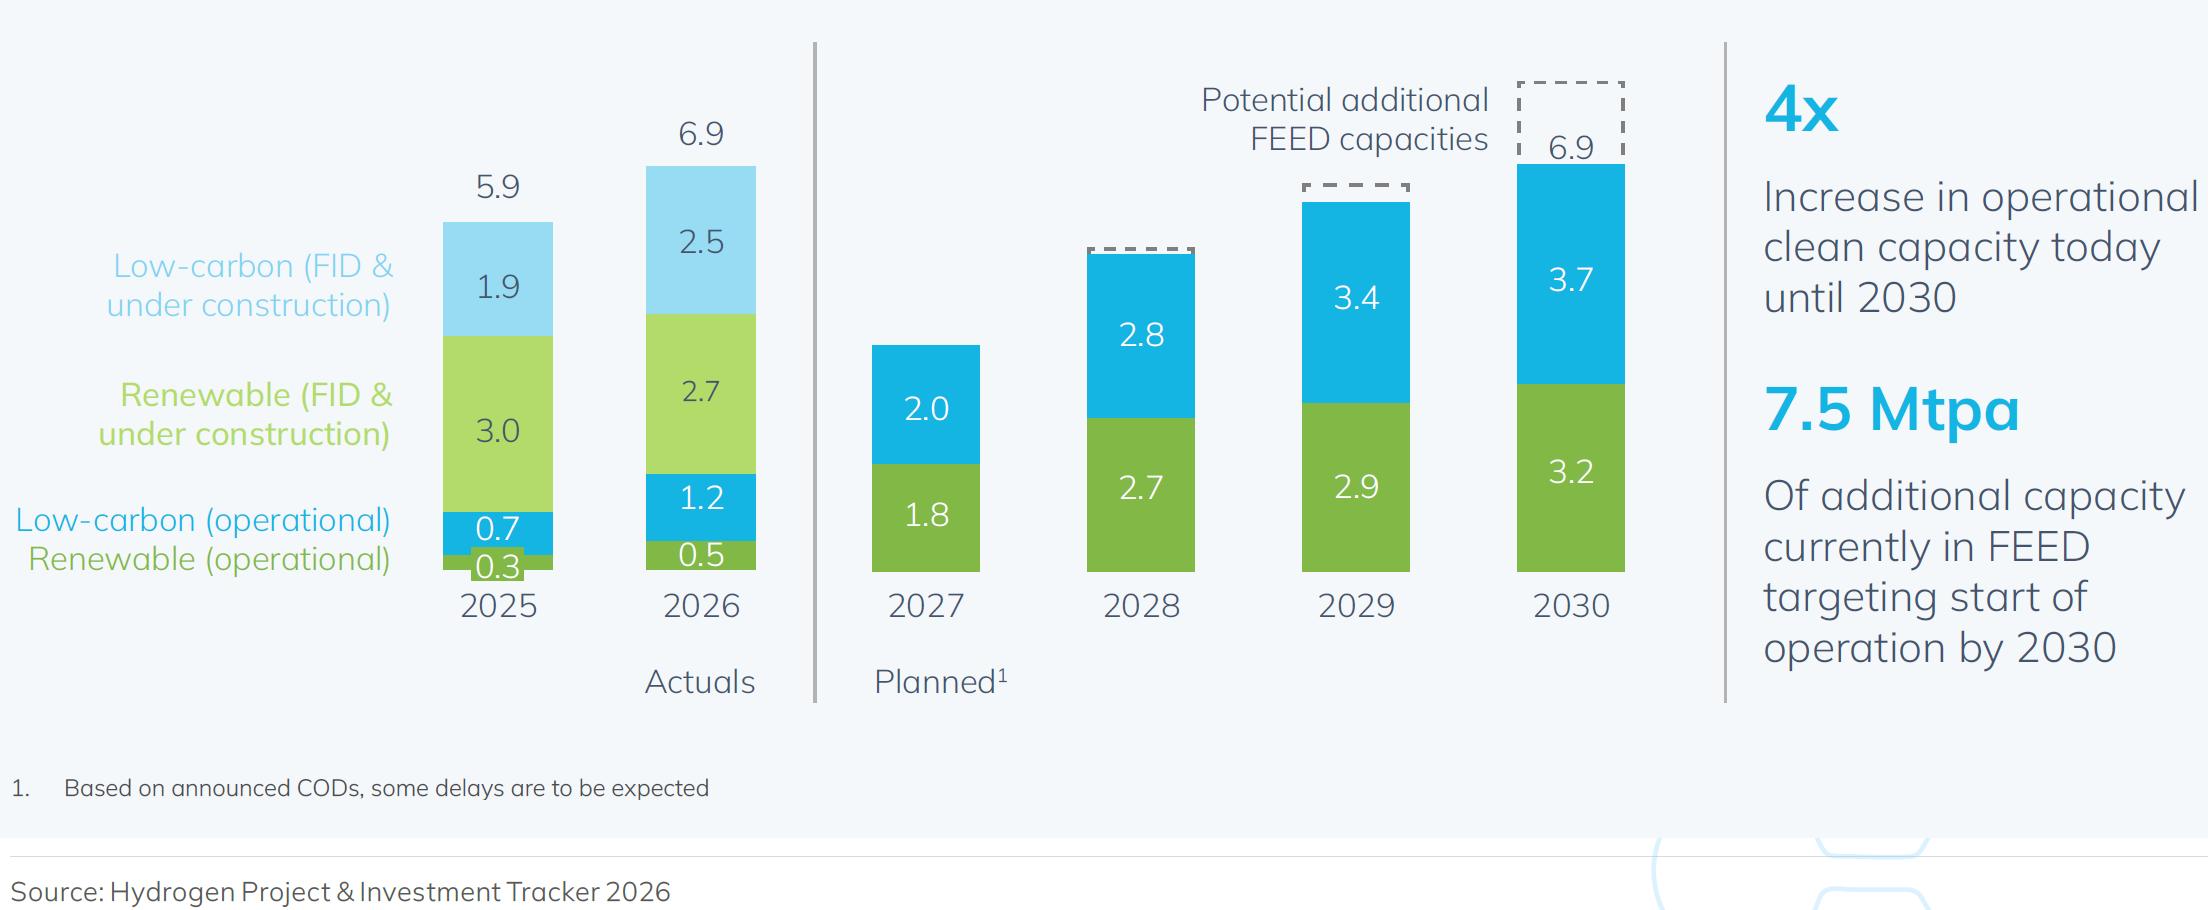
Figure 2. Global committed clean hydrogen capacity by pathway and project status. Values are in million tonnes per year. Future operational capacity is based on announced commissioning dates and remains subject to potential delays. Source: Hydrogen Council, Global Hydrogen Compass 2026, Exhibit 11.
Bankable Demand Matters More Than Headline Market Potential
The report identifies approximately 11 million tonnes per year of potential clean hydrogen demand by 2030 that could have a policy-supported positive business case.
This is not equivalent to contracted demand.
Approximately 6 million tonnes per year is supported by policies already implemented or operationalized. A further 5 million tonnes per year depends on additional implementation of existing policy commitments.
Binding offtake stands at approximately 4.2 million tonnes per year of hydrogen equivalent, including purchase agreements and qualifying captive consumption.
According to the report’s detailed offtake breakdown, ammonia represents 43% and refining 28% of contracted volumes—a combined share of approximately 71%. Existing industrial hydrogen applications therefore remain central to near-term deployment.
Renewable methanol, synthetic aviation fuels, steel and mobility are creating additional opportunities, but they have not displaced established industrial applications as the principal demand base.
For technology development, this supports an application-led approach. Customers require more than hydrogen production capacity: they need appropriate purity, pressure, supply continuity and compatibility with existing processes.
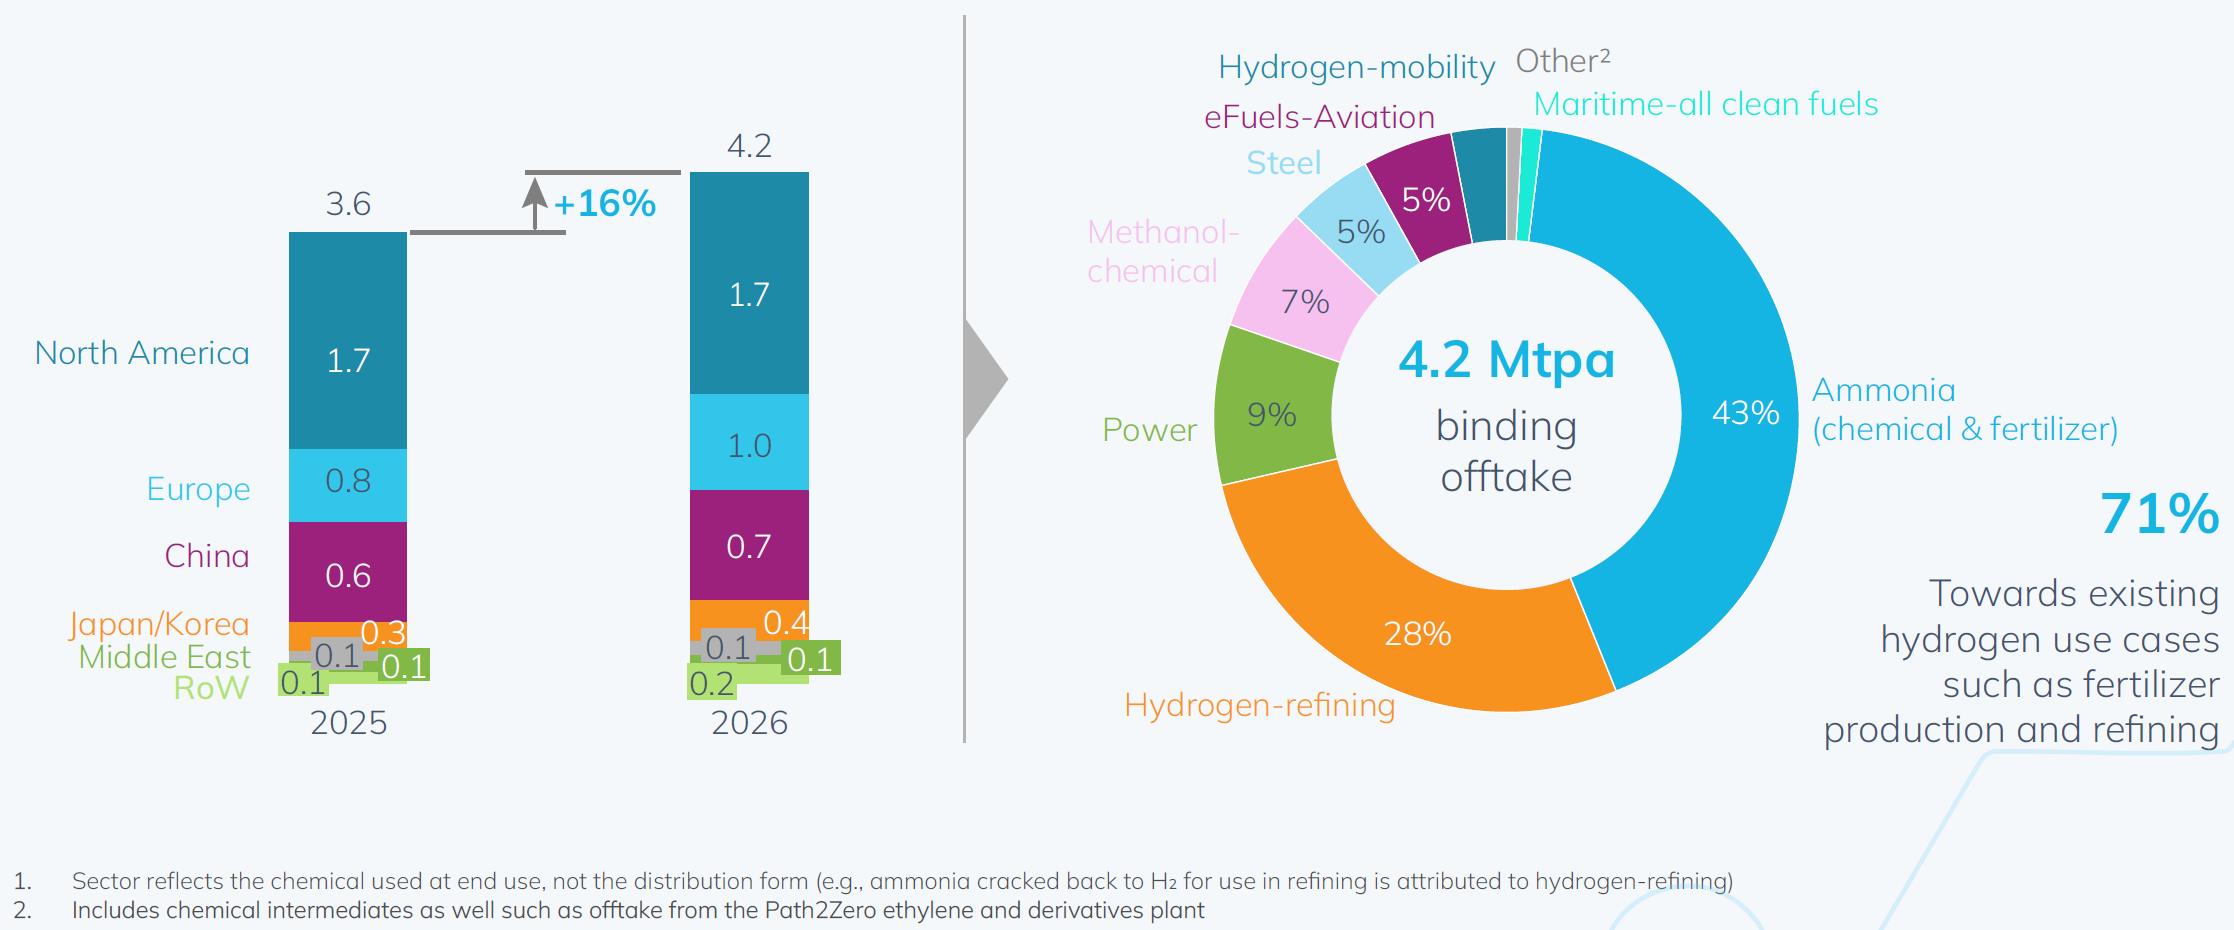
Figure 3. Binding clean hydrogen offtake by destination region and end-use sector, expressed in hydrogen equivalent. Ammonia and refining together account for approximately 71% of contracted volumes. Source: Hydrogen Council, Global Hydrogen Compass 2026, Exhibit 19.
Regional Markets Are Following Different Development Paths
The report examines four representative hydrogen ecosystems.
Europe: policy-backed end-use demand.
Implementation of transport requirements under the Renewable Energy Directive III, or RED III, is helping create demand for renewable hydrogen. An important early pathway is replacing conventional hydrogen in refineries, rather than supplying hydrogen vehicles alone. Projects serving this market must consider electricity sourcing, certification and emissions accounting alongside production cost.
China: coordinated manufacturing, renewable power and industrial demand.
China accounts for approximately US$45 billion in committed investment and more than half of global committed renewable hydrogen capacity. Refining, ammonia and methanol provide substantial industrial demand, while mobility adds distributed end uses. A key engineering challenge is connecting variable renewable power with downstream processes that require dependable feedstock supply.
The U.S. Gulf Coast: resources and existing infrastructure.
Natural gas availability, established ammonia facilities, hydrogen networks, ports and developing carbon transport and storage infrastructure support low-carbon hydrogen and ammonia. The report also incorporates the contribution of relevant policy incentives. This illustrates that end users may compare multiple eligible low-emission pathways on delivered cost, emissions intensity and reliability.
India: fertilizer demand combined with power, equipment and procurement advantages.
Renewable electricity arrangements, equipment costs, utilization, policy support and long-term purchasing agreements jointly improve renewable ammonia economics. However, production arrangements serving the domestic market do not automatically meet European renewable fuel requirements. Export projects must reassess both compliance and cost.
Across these regions, progress depends on connecting supply, demand, infrastructure and enabling mechanisms—not on a single technology operating in isolation.
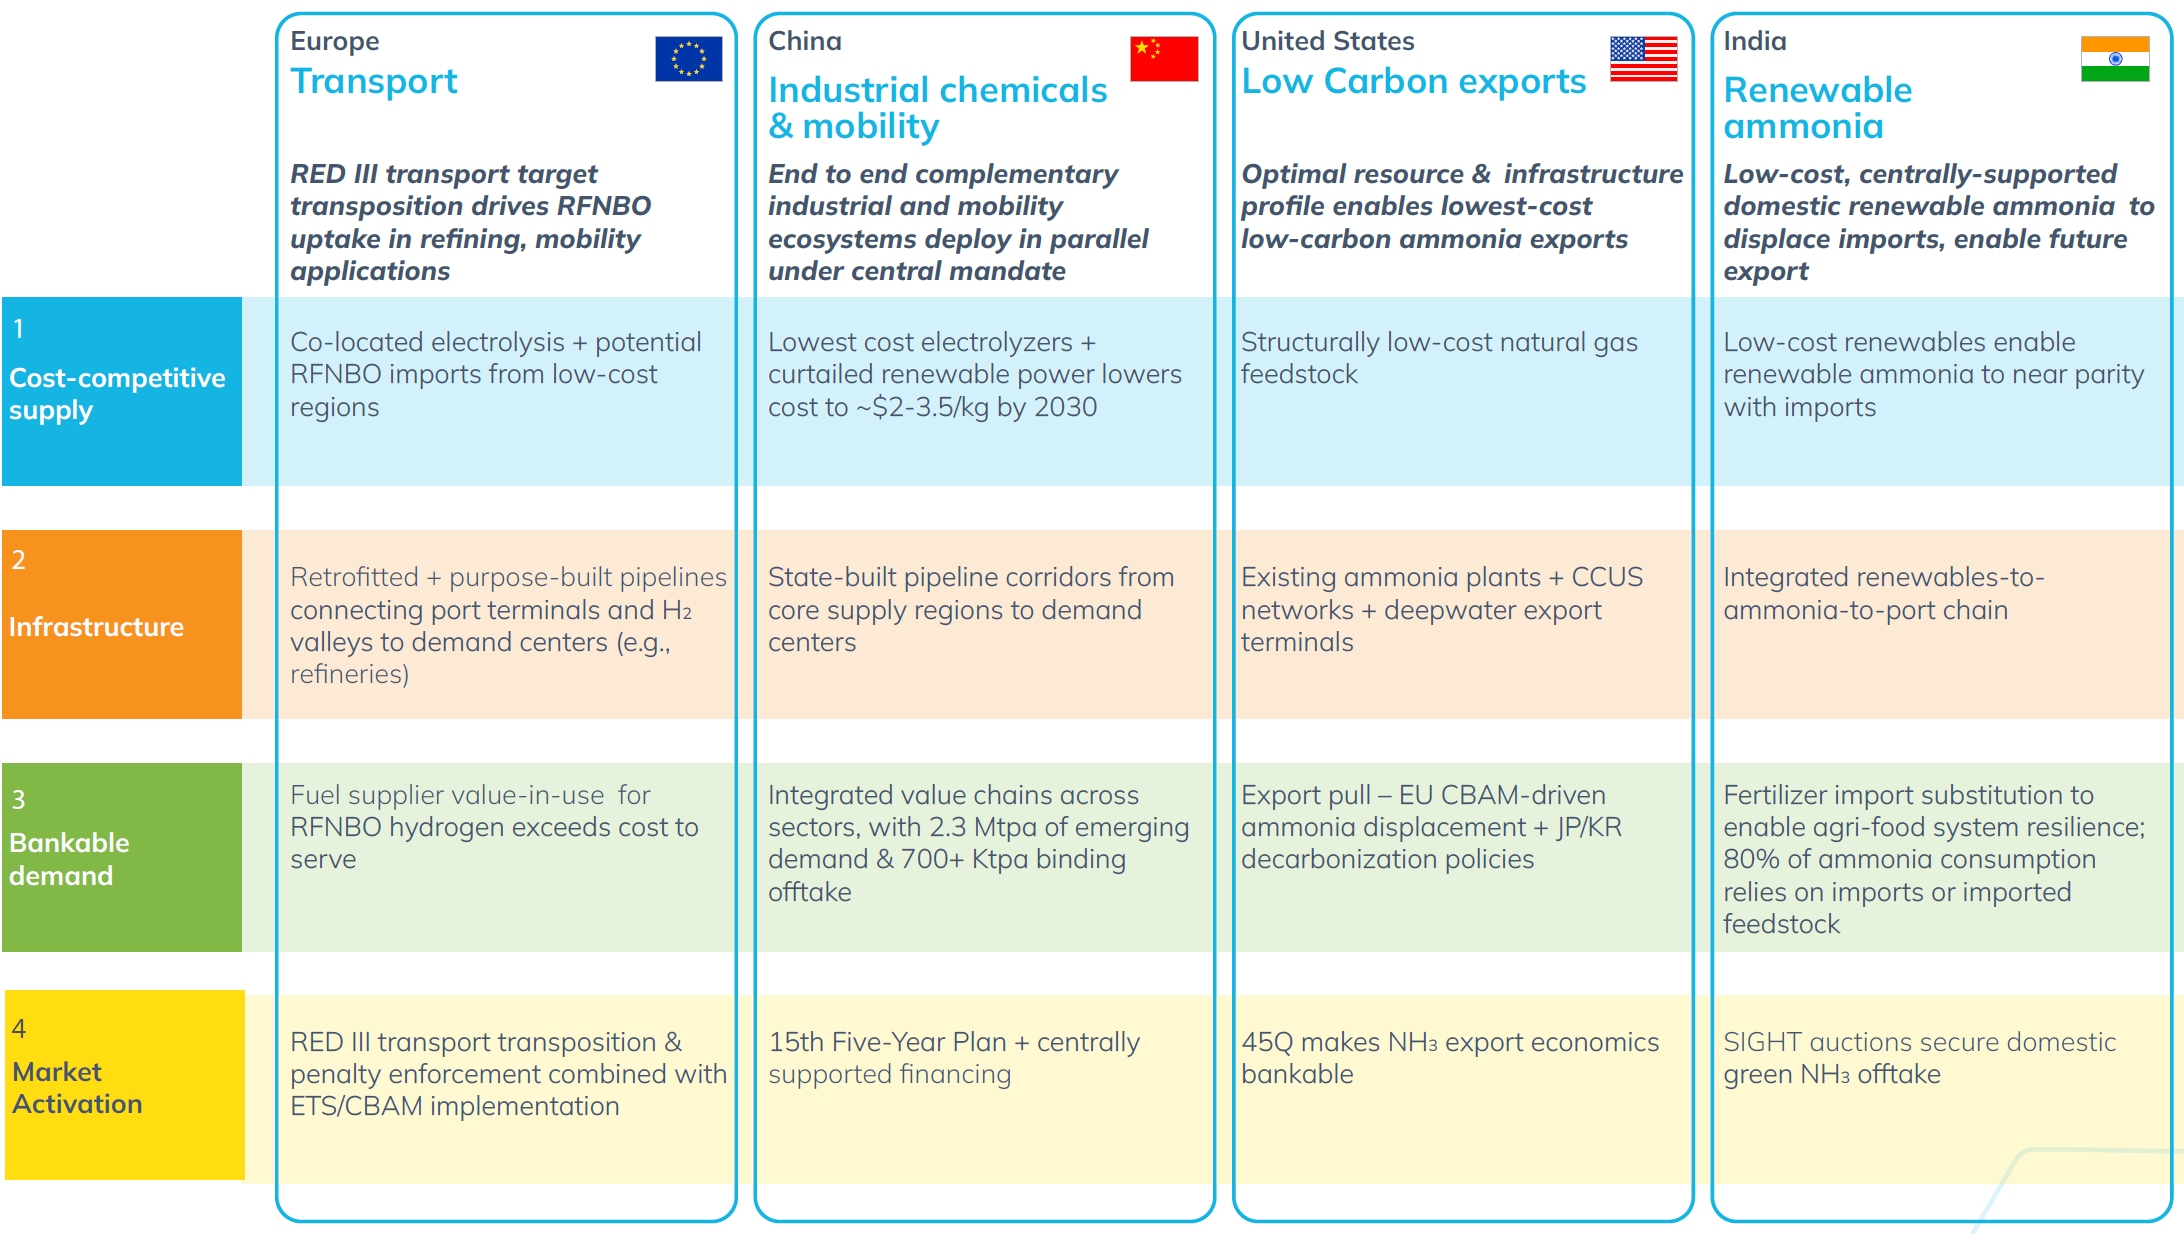
Figure 4. Emerging clean hydrogen ecosystems in Europe, China, the United States and India. Regional development drivers differ, but each ecosystem requires competitive supply, infrastructure, bankable demand and market-enabling mechanisms. Source: Hydrogen Council, Global Hydrogen Compass 2026, Exhibit 22.
Electrolyzer Cost Reductions Must Be Evaluated at System Level
The report estimates that Chinese alkaline electrolyzer system costs declined by approximately 45% between 2020 and 2025.
Lower capital costs can enable different operating strategies, including the use of fewer hours of lower-cost electricity. However, lower equipment prices do not translate automatically into proportional reductions in delivered hydrogen cost.
Electricity prices, utilization, system efficiency, lifetime, maintenance, compression, storage and transport all affect project economics. Lower electricity prices and higher utilization may also involve competing requirements.
The report discusses renewable hydrogen production costs of approximately US$3.5/kg in some Chinese projects and the possibility of approaching US$2/kg by 2030. These figures are conditional, not national averages or universally available delivered prices.
Likewise, cost trends for alkaline systems should not be transferred directly to PEM, AEM or other electrolysis technologies. Meaningful comparisons require consistent operating assumptions and system boundaries.
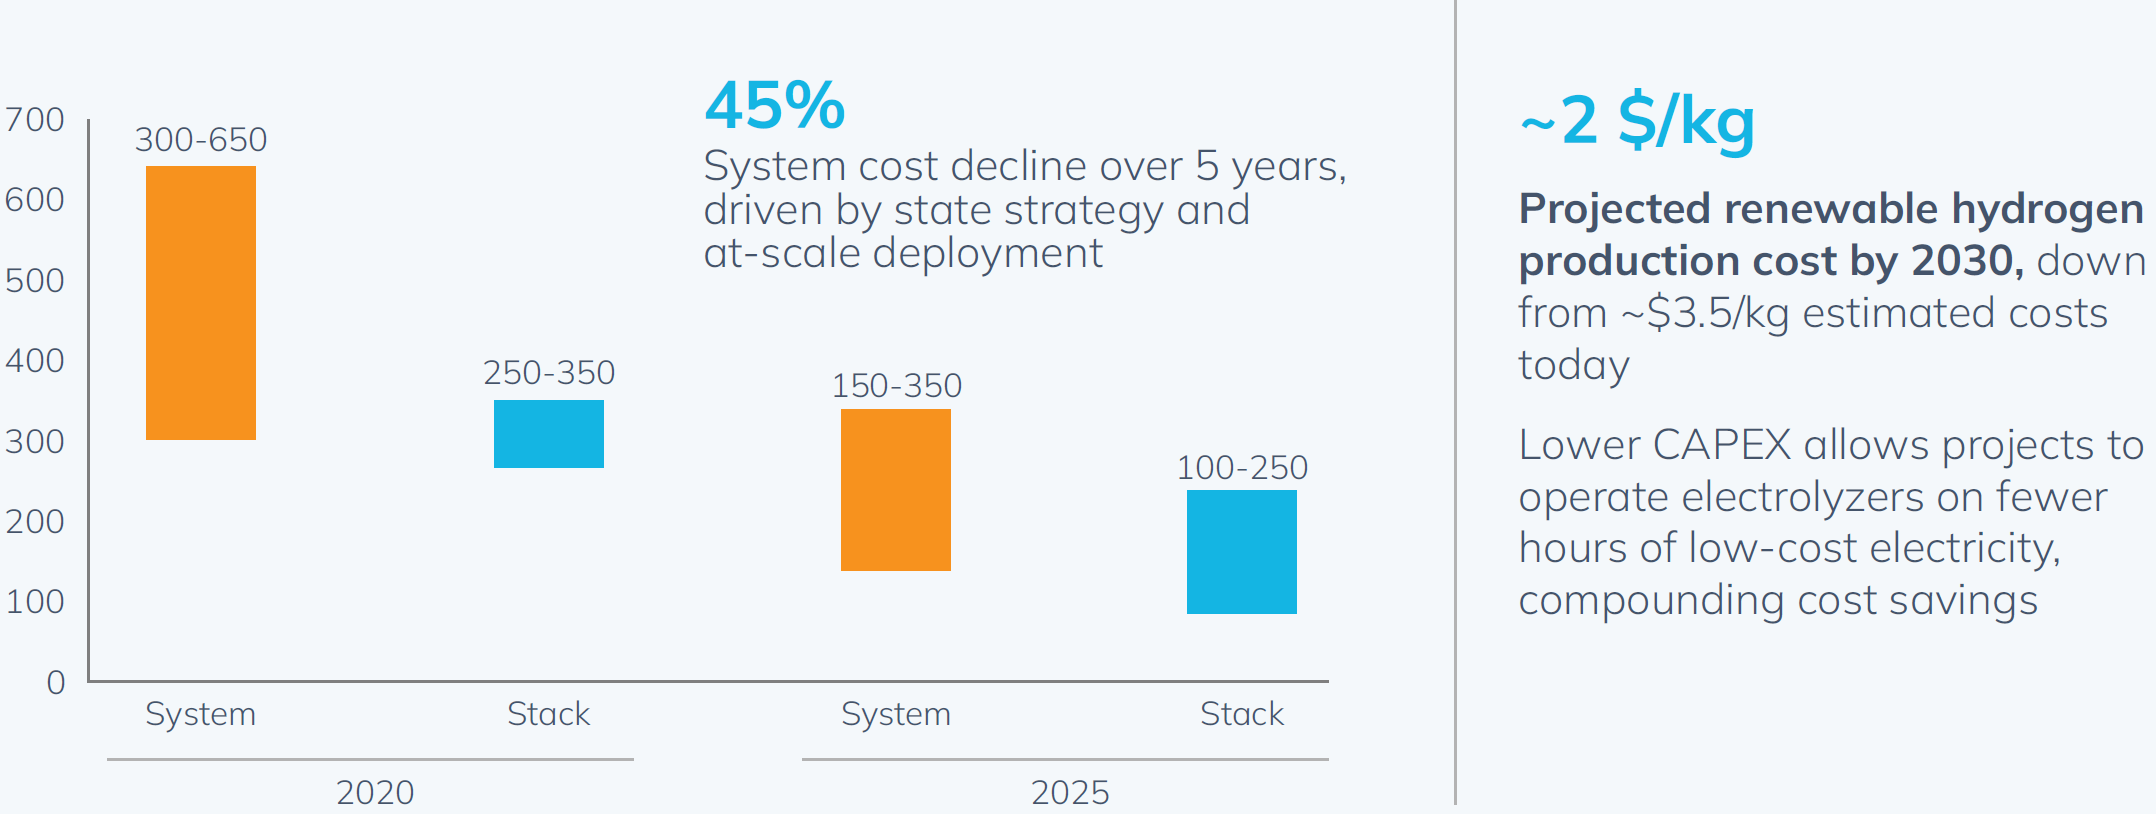
Figure 5. Changes in Chinese alkaline electrolyzer system and stack costs, expressed in US$/kW. The hydrogen production cost indicated for 2030 is a conditional projection, not a current market quotation. Source: Hydrogen Council, Global Hydrogen Compass 2026, Exhibit 28.
Implications for AEM and Other Electrolysis Technologies
For AEMHY, with its focus on anion exchange membrane water electrolysis, the report provides useful industrial context. It does not establish the technical superiority or commercial readiness of any individual electrolysis pathway.
Our interpretation highlights four priorities:
Evaluate realistic operating conditions. Efficiency and current density should be considered alongside load changes, start-stop operation, degradation, gas quality and availability.
Connect materials performance with system requirements. Membranes, ionomers, electrodes and stacks need to be assessed together with power supply, fluid management, gas treatment and controls.
Design around the customer’s process. Refining, ammonia, methanol and other applications have different hydrogen supply requirements.
Build a traceable evidence base. Clear test boundaries, repeatable results and long-term operating records help customers assess technical and execution risks.
Conclusion
The Global Hydrogen Compass 2026 describes an industry that continues to grow, while projects face increasingly rigorous requirements for demand certainty, cost competitiveness and execution.
For technology developers and equipment suppliers, competitiveness will depend not only on material or equipment specifications, but also on understanding customer processes, integrating systems and delivering dependable operation.
Turning technical advantages into demonstrable, deliverable and maintainable industrial capability is a central challenge—and opportunity—in the next phase of hydrogen deployment.
Source: Hydrogen Council, Global Hydrogen Compass 2026, September 2026, incorporating research and analysis conducted in collaboration with McKinsey & Company.
Editorial note: This article was prepared by AEMHY for industry knowledge sharing. Data, project status and projections reflect the report’s definitions and assumptions; they are not real-time quotations or guaranteed outcomes. Technical implications are AEMHY’s interpretation and do not imply endorsement of any company or technology by the report’s authors. Rights to the original report and figures remain with their respective owners.